Identifying the source of noise when performing R&D, maintenance or product testing, is rarely straightforward. Traditional measurement techniques can tell you how loud something is, but struggle to give you exact placement of the noise source and make it hard to present your findings.
When dealing with complex machinery, vehicle interiors, or industrial environments, sound can reflect, propagate, and interact with surrounding structures. This makes pinpointing the true source of a problem extremely challenging.
So how do we solve this problem, instead of using sound level as the indicator, we use sound location. This is where sound visualisation changes the game.
But why does visualisation matter.
Engineering often deals with extremely complex problems, and sometimes presenting this data in a way that can be truly understood can be a challenge. Instead of presenting a list of sound pressure levels and locations, being able to show off a clear heatmap overlayed on top of the subject is an invaluable tool for development.
Sound visualisation allows engineers to:
- See how sound propagates
- Identify dominant radiation surfaces
- Understand vibration-to-noise coupling
- Prioritise the loudest contributors
This makes troubleshooting significantly faster and provides a much clearer visual of where problems lie.
Introducing Scan&Paint 3D
This where tools like Scan&Paint 3D shine. Most acoustic measurements rely on sound pressure alone. However, sound pressure does not provide directional information about how sound energy is moving.
Scan&Paint 3D measures both:
- Sound pressure
- Particle velocity
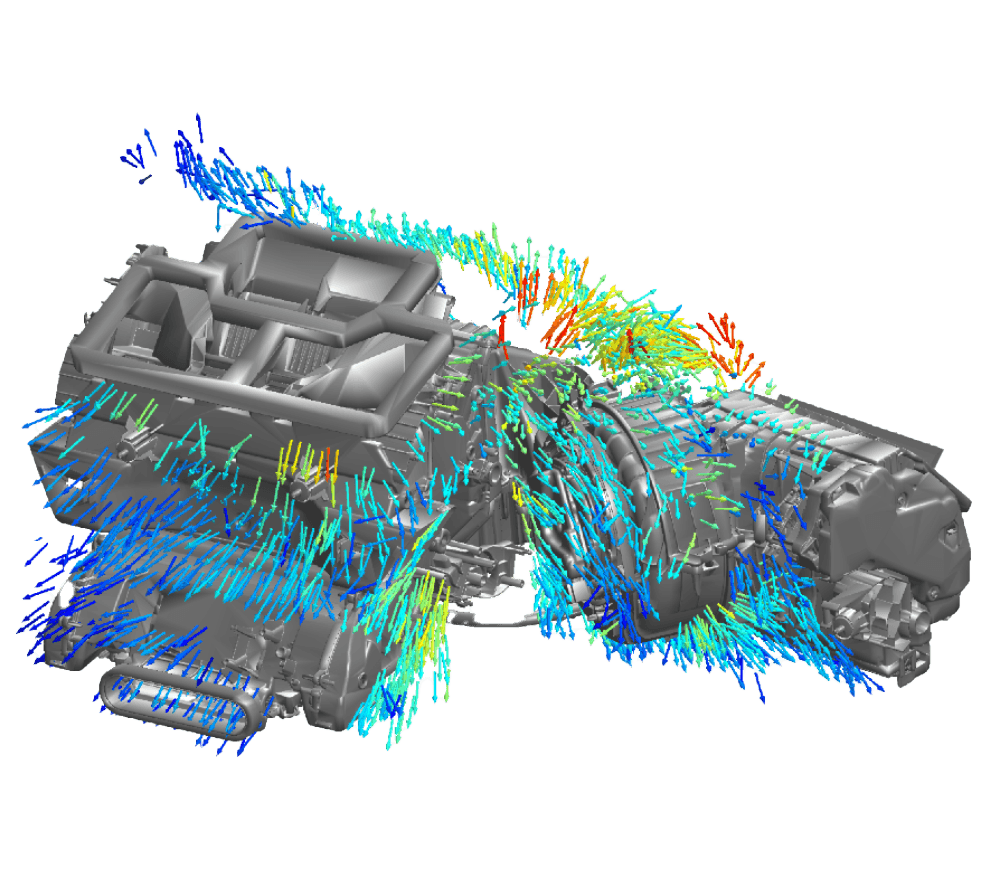
This enables direct calculation of sound intensity vectors, showing both the magnitude and direction of acoustic energy flow. This is what allows the system to create true 3D sound intensity maps.
Understanding the Technology Behind Scan&Paint 3D
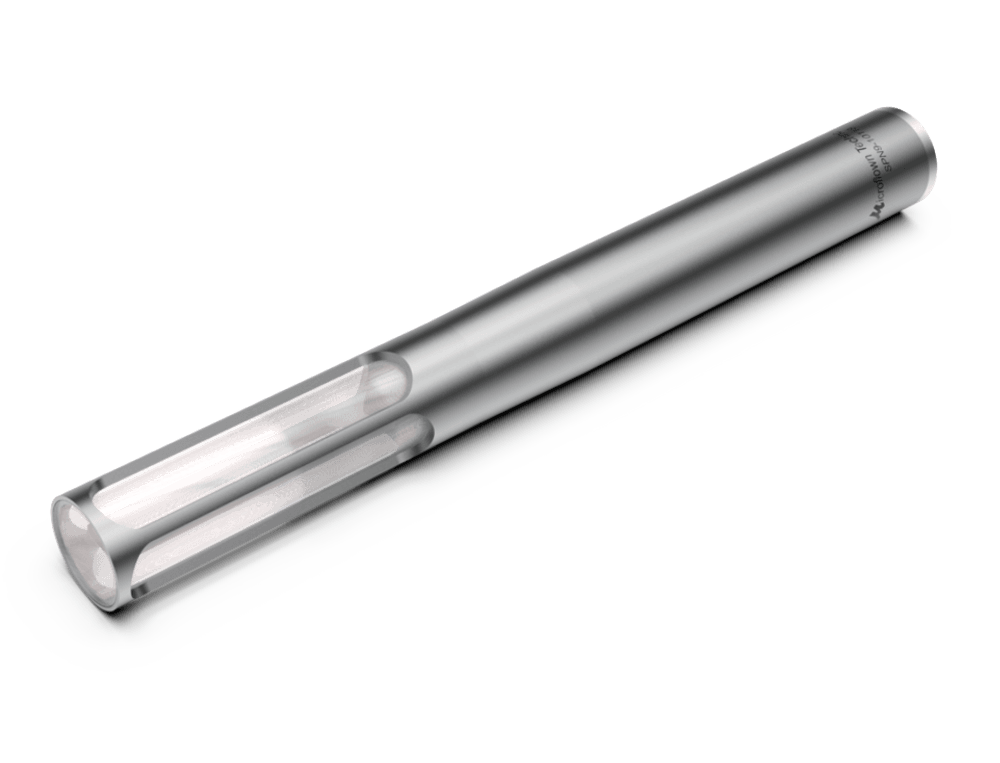
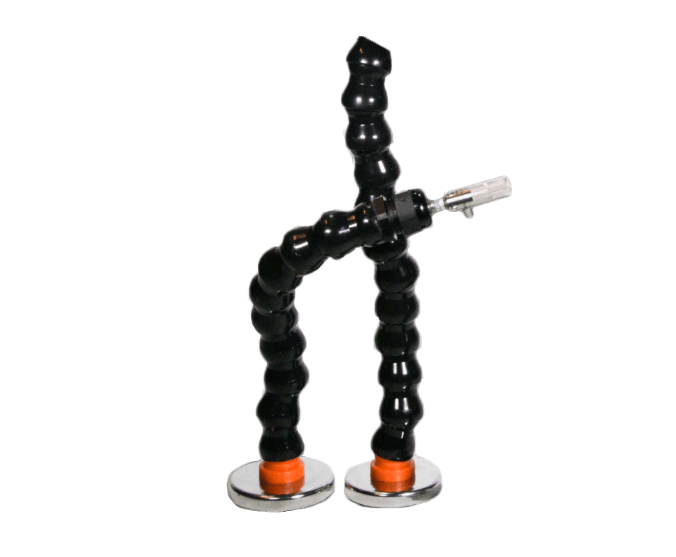
Scan&Paint 3D is powered by advanced sensor technology, utilising a three-dimensional ½ inch USP regular probe equipped with Microflown acoustic particle velocity sensors and a sound pressure microphone.
This allows for direct measurement of all acoustic quantities, including tri-axial particle velocity with no frequency limitations.
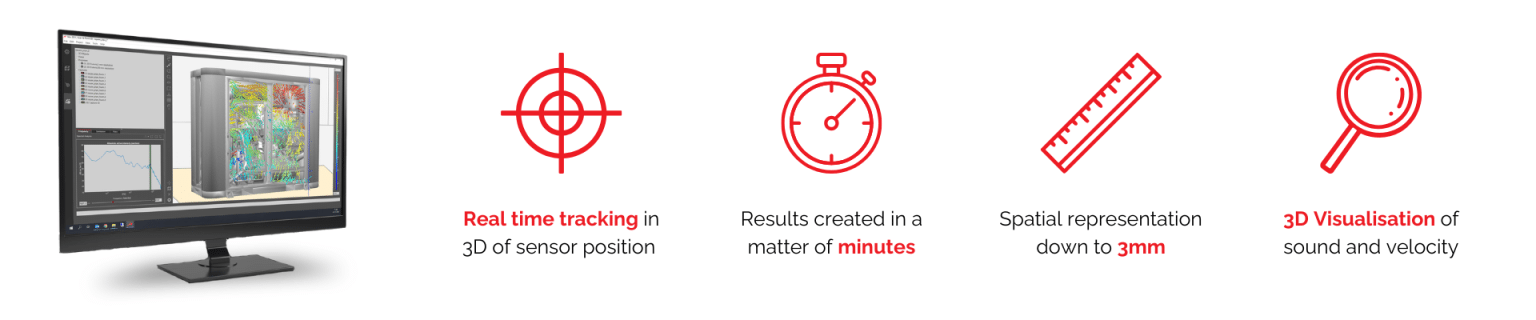
Real-Time 3D Tracking
Scan&Paint 3D combines acoustic measurements with what is known as optical tracking technology. This is essentially an infared stereo camera that continuously tracks the exact position and orientation of the sensor as it moves around the object being measured. What makes this an extremely useful feature is that it allows the system to:
- Easily map measurements on to a 3D model
- Create full spatial sound maps
- Combine multiple measurement paths
This gives you a completely 3D representation of the sound field of your subject.
Precise Sound Localisation
One feature that proves the power of Scan&Paint 3D, is its ability to localise sound sources with unmatched precision. Using advanced algorithms and real time tracking, users can pinpoint the exact location of noise sources, visualising sound propagation in full 3D.
This level of accuracy is crucial for troubleshooting, optimising, and managing sound environments.
The tiny 3D sensor makes it possible to obtain results with a very high spatial resolution, down to 3mm, enabling measurements even on very small objects. – Microflown
Directly Import Your 3D Models
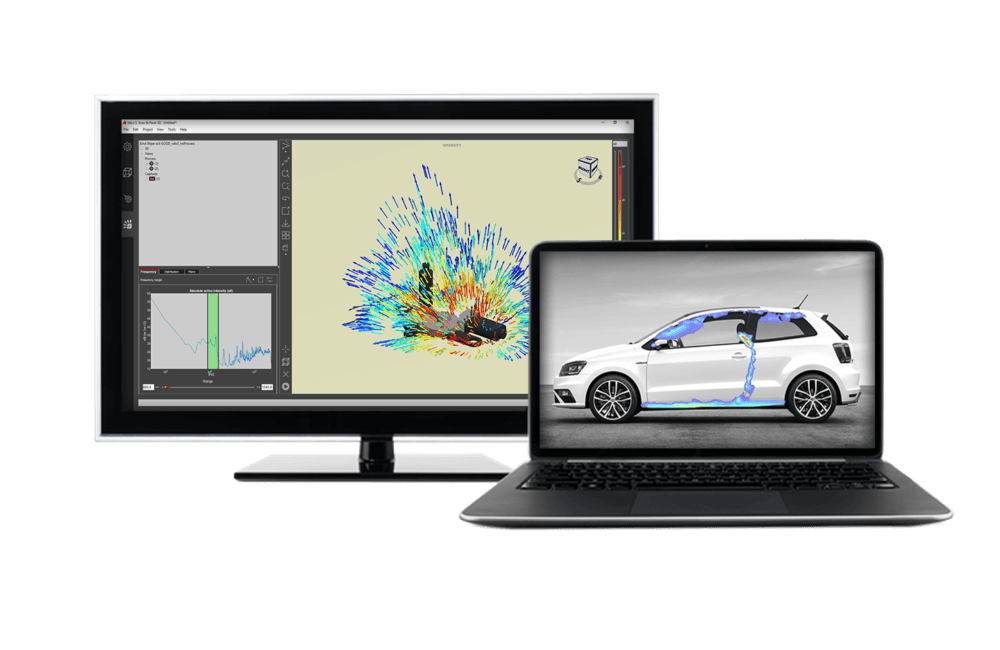
All results given by Scan&Paint 3D are visualised on an interactive 3D model which can directly import a variety of standard file formats. Scan&Paint 3D also embedded tools to modify loaded files.
File format standards from popular programs like CAD and Sketchup – Such as .onj, .stl, .3DS, .Shape and .dae.
If you do not have a 3D model to start with, an alternative method is available, using a program called structure sensor that swiftly generates a detailed 3D model in a compatible file format.
How Scan&Paint 3D Can Benefit Your Business
So now we know what Scan&Paint 3D does, but how can it really benefit your work?
This system can massively increase the efficiency of your work, giving you a faster way to identify noise sources or leakage. Instead of taking multiple microphone measurements and trying to interpret them later, the system records sound intensity and position simultaneously.
Scan&Paint 3D also provides you with much more detailed and presentable reports. You can still provide your existing data the way you were doing before, analysing multiple graphs, spectra, measurement points, etc. But with Scan&Paint you can also present this data in an intuitive visual format, displaying sound intensity vectors and pressure distributions directly on a 3D model.
This allows users to instantly see where acoustic energy is radiating from and how it propagates through the environment.

Identifying the true source of unwanted noise is one of the most difficult challenges in acoustics.
Scan&Paint 3D changes that by allowing engineers to see exactly how sound behaves in three-dimensional space.
By combining particle velocity sensing, real-time tracking, and advanced visualisation, it provides a powerful tool for troubleshooting, product development, and acoustic optimisation.
Find out more about Scan&Paint 3D or talk to one of our experts.