
Lontra are an engineering company that develops high-efficiency industrial air and gas handling equipment. They are best known for their patented Blade Compressor® technology, which is designed to improve efficiency compared to traditional compressors and blowers.
Lontra has a culture of innovation, encouraging thorough engineering evaluation to design better products. They wanted a rigorous approach to identify and precisely target key noise sources in their new blower, helping them efficiently achieve a quieter product.
When developing their new LP2 compressor, they had to navigate low-frequency noise in real-world environments, where traditional testing methods can struggle to pinpoint the true source of the problem.
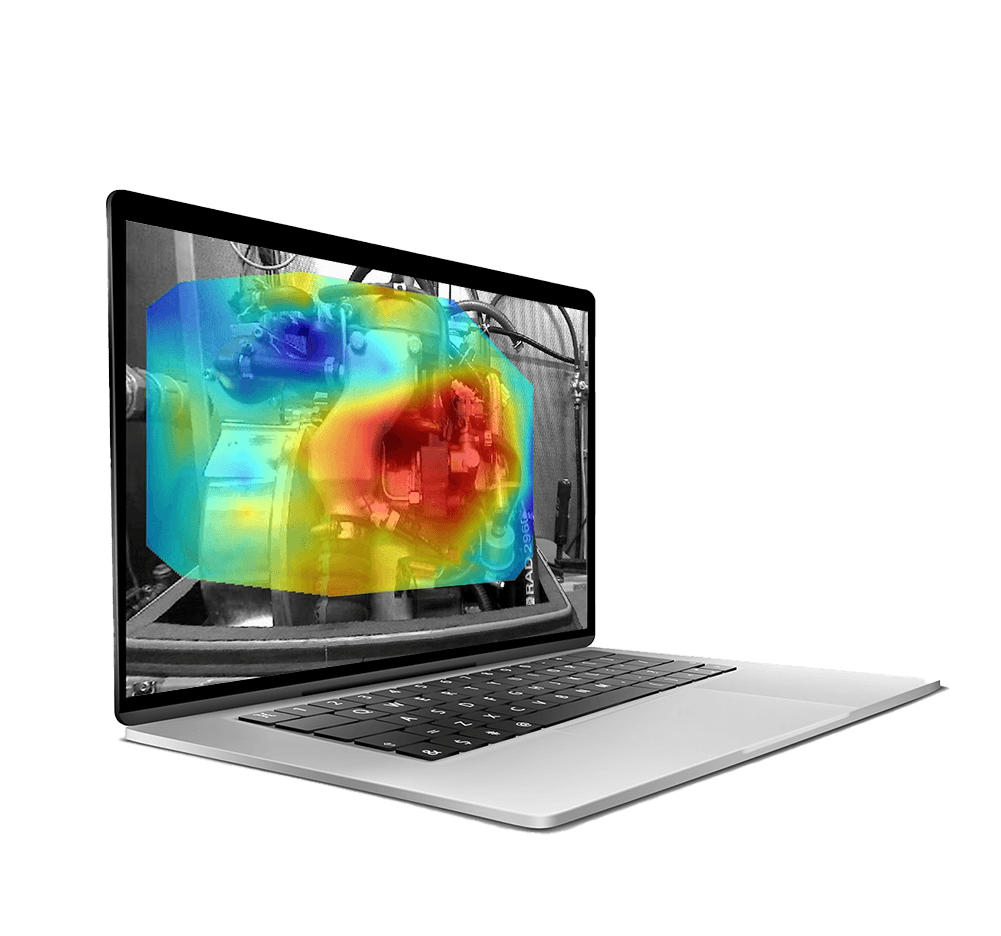
Using Scan&Paint 3D, engineers were able to identify dominant noise sources and visualise how sound was behaving across the enclosure. This was used to reduce overall sound power emissions by giving clear visualised data which help design targeted improvements to the product.
The Challenge
The LP2 is the first fully packaged blower manufactured by Lontra using its proven patented Blade Compressor technology. It operates at up to 1barG, delivering up to 2600m3/h of air at 2500rpm.
Operating at up to 2500 rpm and producing one discharge per revolution, the unit generated significant low-frequency noise.
As a positive displacement machine producing one discharge per revolution, this resulted in low frequencies of emitted noise. This posed some unique acoustic challenges for various aspects of the design and ultimately led Lontra to use the Microflown equipment.
Typically, low frequency noise is notoriously difficult to measure accurately, especially in-situ. Meaning the project required a solution that could:
- Identify dominant noise sources quickly
- Work in a normal test environment
- Measure frequencies below 50 Hz
- Reduce overall sound power levels
While traditional methods were considered, they would have been too expensive due to the need for highly controlled environments. Instead, the team wanted to test and analyse the compressor in realistic operating conditions. This offered invaluable information on the performance of the LP2 when in a real-life setting, not some polished, sanitised test chamber.
The option that suited them best was Scan&Paint 3D.
Why Scan&Paint 3D?
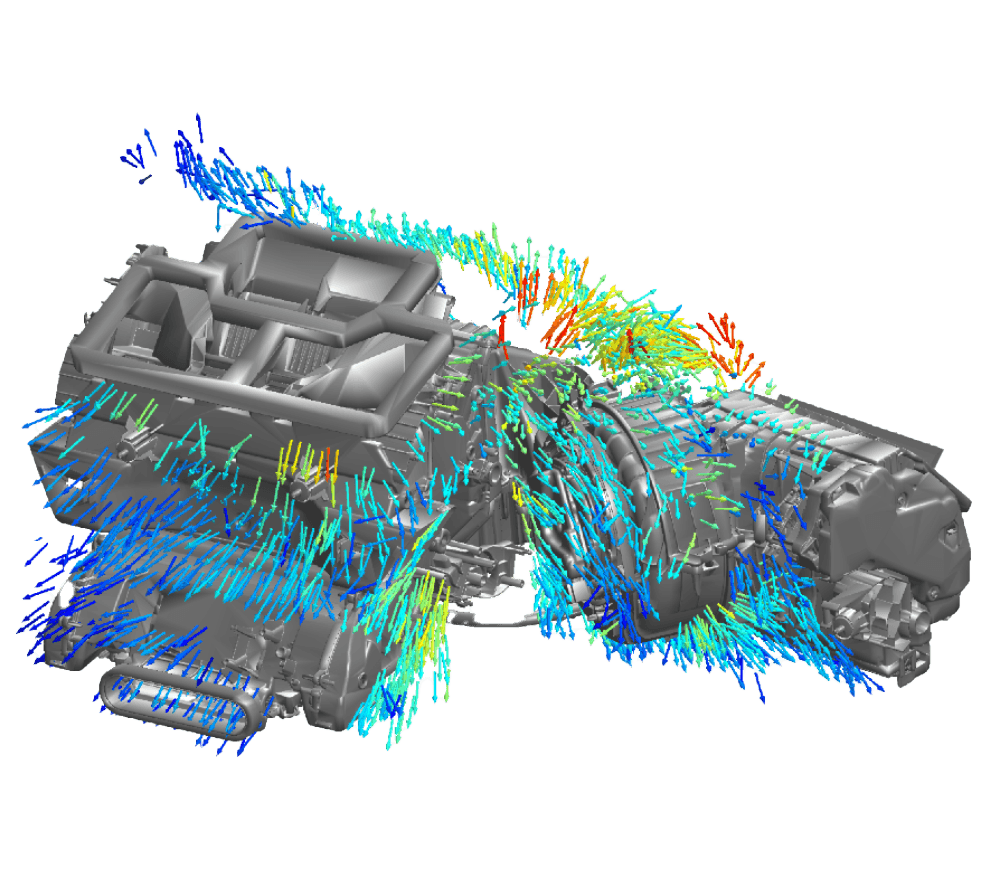
Instead of traditional sound pressure measurements, Scan&Paint 3D uses particle velocity and sound intensity measurements to visualise sound fields in 3D space. By scanning both the inside and outside of the enclosure, engineers could see:
- Where sound was escaping
- Which components were causing issues
- How vibration was travelling through the enclosure
But where Scan&Paint 3D really stood out, was its ability to accurately resolve very low frequencies, even below 50 Hz. The system also allowed for sound power measurements to be carried out in relatively small test cells.
This whole system meant they could avoid setting up highly expensive specialist test facilities.

The Measurement Process
First, a pre-production LP2 unit was fully scanned using Scan&Paint 3D.
The exterior enclosure was scanned first to locate where sound was radiating from the system. The engineers then opened up the enclosure and scanned the internal components individually to identify which sources were generating the most sound.
The LP2 was a large unit, meaning that multiple measurement trajectories were required. This essentially means the engineer had to scan the compressor in several separate passes from different positions to capture the whole machine.
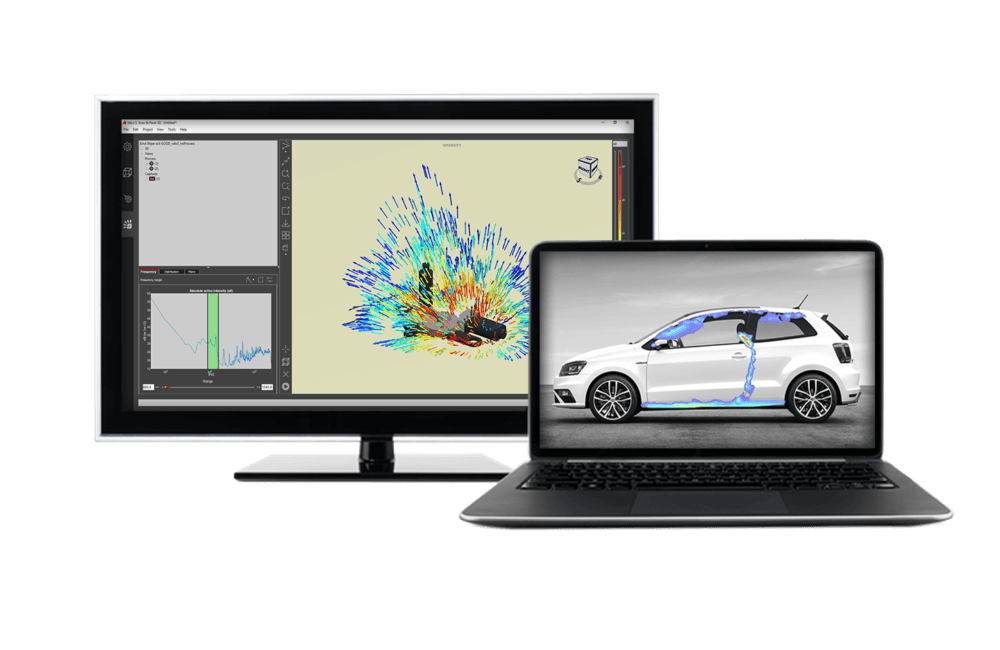
These were combined in VELO software to create a complete acoustic dataset.
Using a tracked 3D sound intensity probe, engineers could manually scan around the compressor while the system captured both the acoustic data and exact probe position in space. This produced 3D visualisations of sound pressure, particle velocity and sound intensity, allowing the full sound field to be analysed.
What Did the Team Discover?
These detailed, visualised results quickly revealed several important issues.
1. Outlet Pipe Cover
One major source of broadband noise was a rattling outlet pipe cover at the rear of the enclosure.
After redesigning the cover, A-weighted emissions from the rear of the enclosure were significantly reduced.
2. Vibration Transmission
The scans also showed that the front panel was not the primary source of noise as originally suspected.
Instead, vibration was being transferred from the rear panel through the inlet silencer, effectively acting as a bridge between the two sides of the enclosure.
By introducing softer anti-vibration mounts, transmitted vibration was greatly reduced.
3. The Real Low-Frequency Source
Originally, engineers believed the air end would be the dominant low-frequency source.
However, Scan&Paint 3D revealed that the main source of pulsation was actually the atmospheric air intake on the inlet silencer.
This completely changed the design direction.
Instead of redesigning the air end, the inlet silencer was modified to better attenuate around 42 Hz.
4. Sound Leaks Around Doors
Using narrow frequency analysis, the team was also able to identify acoustic leakage around enclosure doors.
The issue turned out not to be the seals themselves, but incorrectly tensioned latches.
This allowed quality control improvements to be introduced into production.
This led to a complete overhaul in design, leading to improvements like:
- Redesigned inlet silencer
- Softer anti-vibration mounts
- Stiffened enclosure panels
- Improved outlet pipe cover
- Better enclosure assembly quality control

The Results
And most importantly, how did this affect noise levels?
Well, there was a 2.7 dB reduction in unweighted emission, with a 3.3 dB reduction in A-weighted sound power (the frequency humans hear at).
And most impressively, a 6.4 dB reduction from the rear enclosed area.
The scans also helped prioritise future development work by clearly showing which remaining areas still contributed most to the overall emissions.
Why Particle Velocity Matters
So one of the biggest lessons learned from projects like these, is that there is a big difference between tests performed with sound pressure and those performed with particle velocity.
This is especially prominent when working with low frequencies. At 125 Hz, sound pressure data suggested multiple possible noise source, leaving the results inconclusive and hard to work with.
Particle velocity measurements, however, provided much clearer spatial resolution and showed the true source locations more accurately.
This prevented unnecessary redesign work and allowed engineering efforts to focus on the components that actually mattered.
Working with AcSoft
AcSoft worked with Lontra to perform the Scan&Paint 3D measurements in the UK.
AcSoft prides itself on the support we provide to our customers, helping them not only carry out advanced acoustic testing, but also understand the results and apply them to real engineering challenges.
To find out more about how we could help you, contact us.
To find out more about in-situ testing, check out our free webinar on the 4th June at 11:00AM.