Acoustic troubleshooting and sound source localisation provide insights that traditional measurement techniques can struggle to deliver. This is why tools like Scan&Paint 2D and Scan&Paint 3D are becoming so popular in the engineering field. These tools allow engineers to transform acoustic data into clear visual sound maps, making it easier to identify noise sources and understand how sound behaves around an object.
Both systems have proven cases of simplifying acoustic investigations. But. These 2 systems are built for different applications and measurements. So what exactly is the difference between them?
The Core Idea Behind Scan&Paint
Both Scan&Paint systems are based on particle velocity sensing technology. This measures the actual movement of the air particles caused by the sound waves.
Traditional measurement microphones measure sound pressure. This tells you how strong a sound is. Whereas particle velocity sensors measure how the air particles move, and in which direction the sound travels.
Microflown probes measure both of these, giving you information on both sound pressure and particle velocity.
By measuring both, the system can calculate sound intensity, which reveals the direction and flow of acoustic energy. This is what enables Scan&Paint systems to create clear visual representations of sound behaviour.
What is Scan&Paint 2D
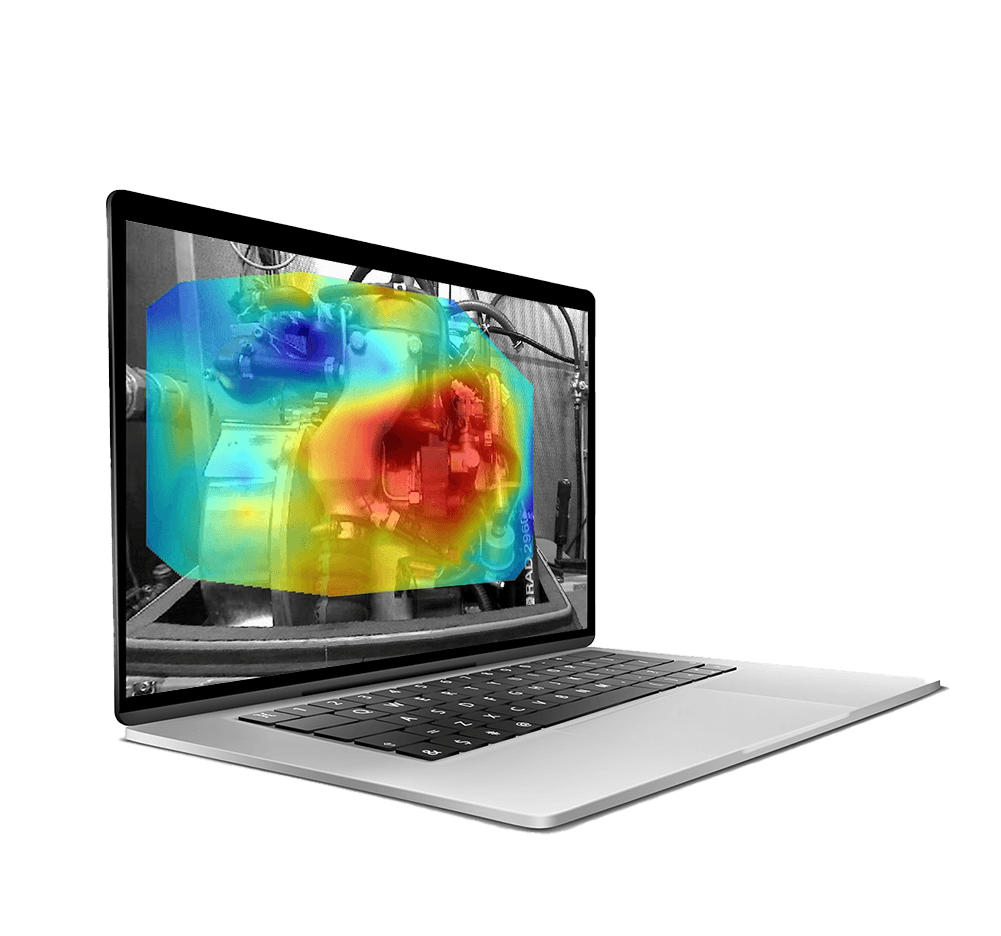
Scan&Paint 2D is a portable sound mapping designed to quickly create high resolution sound maps of stationary sound fields.
So, how does it work? The measurement process is straightforward. The user moves the particle velocity probe across the surface of an object. While this is happening, there is a camera that records the scanning process. This system then synchronises the audio data and video footage to track the probe position and generate a sound map.
This creates visual results displayed as acoustic heatmaps overlaid directly onto an image of the device under test.
This makes it easy to identify where sound is radiating from across a surface.

Scan&Paint 2D is ideal for:
- Troubleshooting noise sources
- Product development investigations
- Identifying sound leakage
- Benchmarking products
- Rapid acoustic measurements in the field
Because the system is portable and fast to deploy, it is often used for quick investigations and on-site measurements.
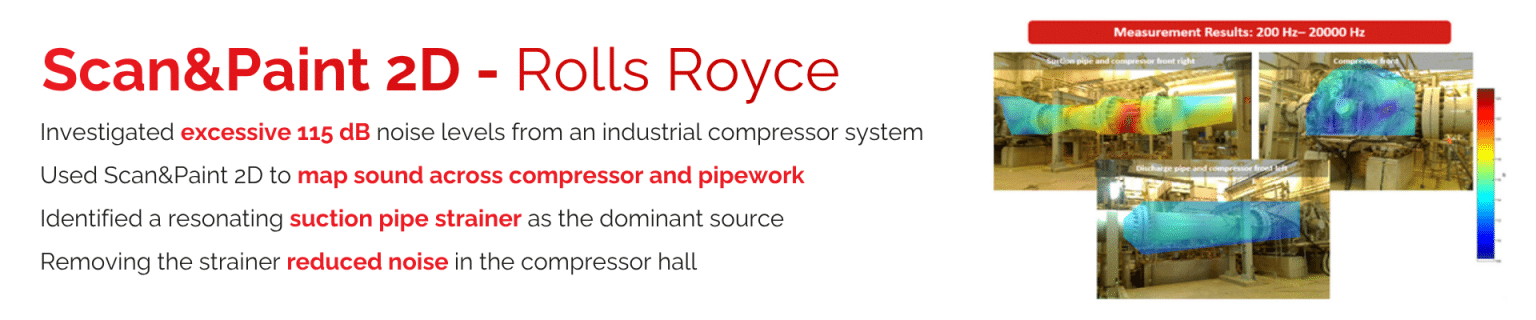
Use Case of Scan&Paint 2D – Rolls Royce
In a project with Rolls‑Royce, engineers used Scan&Paint 2D to investigate excessive noise levels (around 115 dB) from a large industrial gas compressor system. By scanning different sections of the compressor and pipework, the team was able to identify a single dominant noise source within a suction pipe strainer, which was resonating during operation. Once the strainer was removed, the overall noise level in the compressor hall dropped to an acceptable level.
What is Scan&Paint 3D?
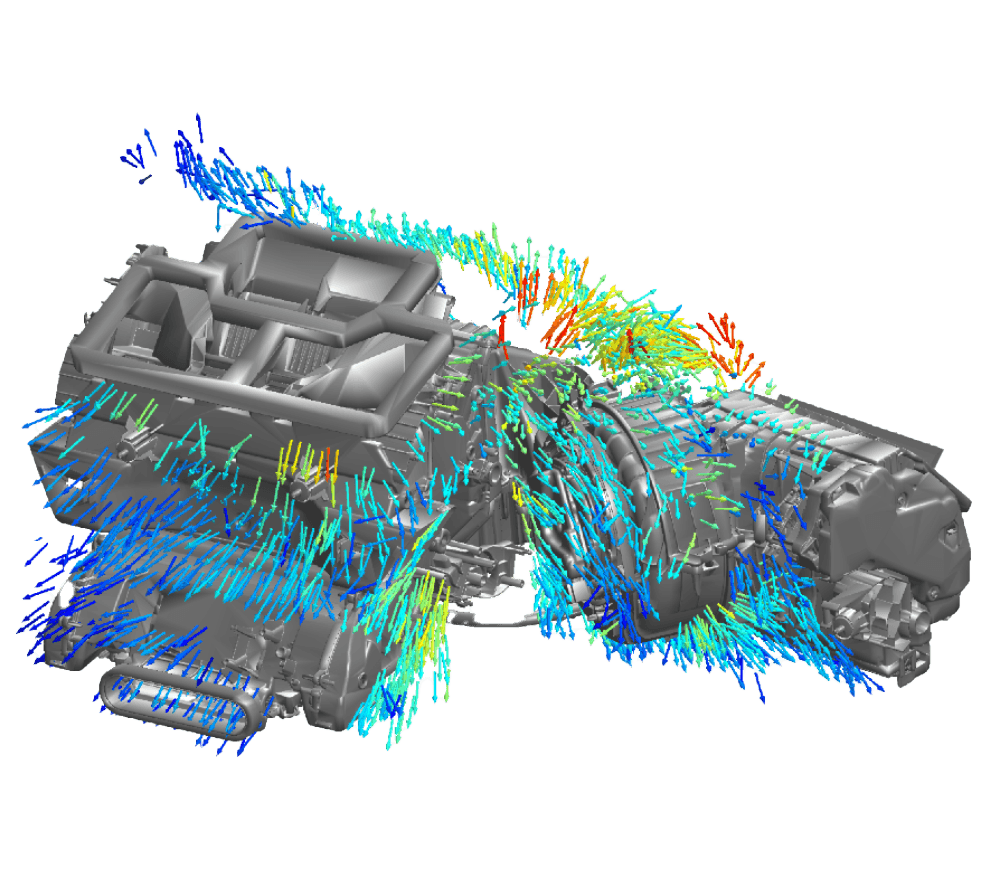
While Scan&Paint 2D focuses on mapping sounds on a single surface as flat measurement plain, 3D takes the acoustic visualisation even further by analysing sound behaviour in a full 3D space using an optical tracking system.
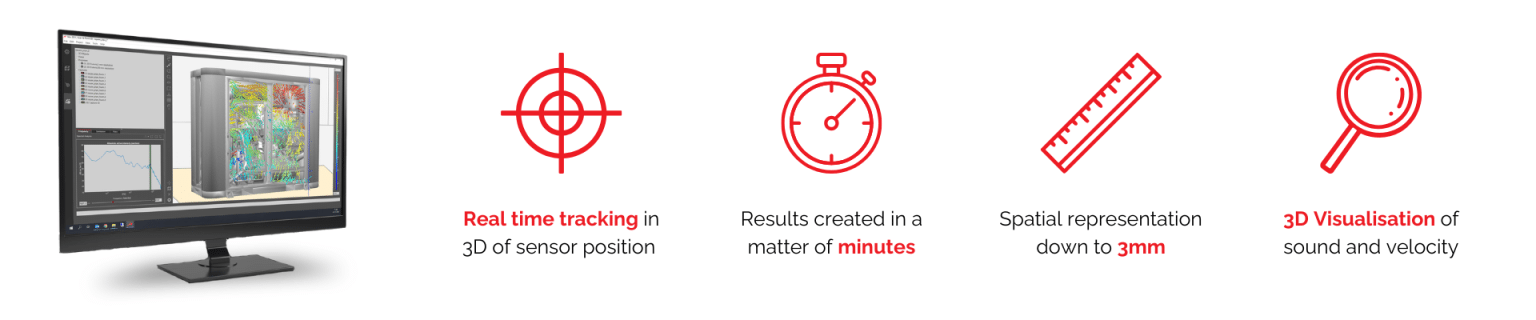
This allows the system to create 3D sound intensity maps around complex objects, showing how sound propagates in all directions. The results are visualised directly on a 3D model of the measured object, providing a complete spatial representation of the sound field.
Scan&Paint 3D is particularly useful for:
- Complex product development projects
• Automotive NVH analysis
• Identifying sound propagation paths
• Detailed sound power investigations
• Analysing acoustic behaviour around complex geometries
This makes Scan&Paint 3D a powerful tool for in-depth acoustic analysis and research applications.
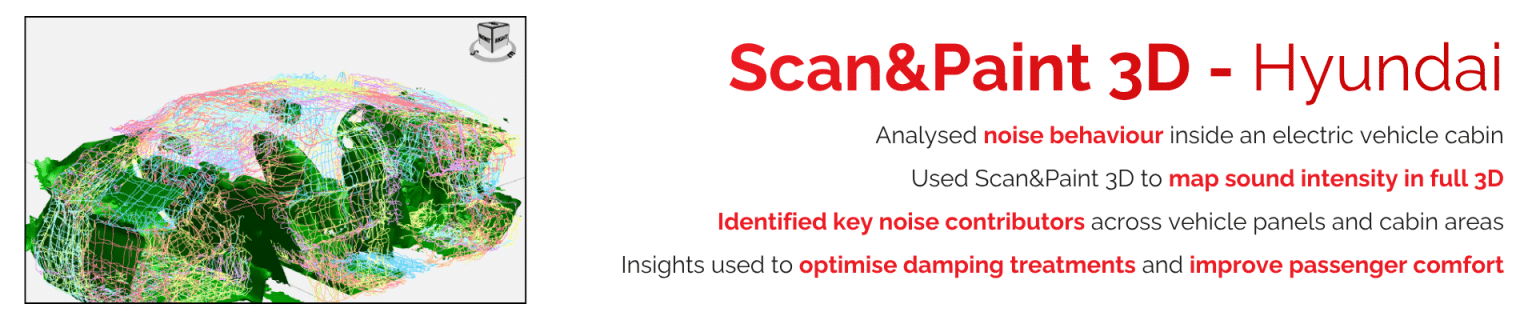
Use Case of Scan&Paint 3D – Hyundai
Hyundai Motor Company used Scan&Paint 3D to study acoustic behaviour inside an electric vehicle cabin. By mapping the sound field in three dimensions, engineers could identify which parts of the vehicle structure were contributing most to interior noise, helping them optimise damping treatments and improve passenger comfort.
Scan&Paint 2D vs Scan&Paint 3D- Key Differences at a Glance
| Feature | Scan&Paint 2D | Scan&Paint 3D |
| Measurement type | Surface sound mapping | Full 3D sound field mapping |
| Visualisation | Acoustic heatmap on photo | Sound intensity mapped on 3D model |
| Measurement approach | Manual scanning across surface | Probe tracked in 3D space |
| Setup time | Very fast | Slightly more advanced setup |
| Ideal use cases | Troubleshooting and rapid investigations | Advanced acoustic analysis |
| Complexity | Simple and portable | More detailed and comprehensive |
Which One is Right for You?
When deciding between Scan&Paint 2D vs Scan&Paint 3D, it largely depends on what exactly you are trying to achieve with your acoustic investigation.
If your goal is to quickly locate noise sources on a surface or product, Scan&Paint 2D provides a fast and highly effective solution. 2D is best for applications like product noise troubleshooting, sound leakage detection and general acoustic benchmarking.
However, if you need to understand how sound propagates around complex structures or within three-dimensional environments, Scan&Paint 3D offers a much deeper level of analysis. Scan&Paint 3D is best suited to more advanced uses, such as NVH analysis, complex product development or sound power / radiation analysis.
In simple terms:
- Scan&Paint 2D is ideal for quick surface-based troubleshooting and sound mapping.
- Scan&Paint 3D is designed for deeper analysis of how sound behaves in three-dimensional space.
But, in many cases, the two systems can actually complement each other, with Scan&Paint 2D used for rapid troubleshooting and Scan&Paint 3D used for more detailed investigations.
Head to our website to find out more about Scan&Paint 2D or Scan&Paint 3D or get in touch with our experts.,