By John Shelton, Technical Director and Chair of IOA M&I Committee
Sometimes it’s difficult to keep up with the innovations in noise and vibration technology, and over the past 50 years or so, we have moved from van-sized analogue analysers to hand-held multi-function digital devices.
A large part of these developments has been down to parallel developments in much larger markets such as computing and studio recording, but our specialised manufacturers have been happy to hitch a ride.
In the early days, if a detailed analysis of the sound or vibration was required, it often meant using a magnetic tape recording to save the signal from the transducer, which could then be replayed through a laboratory-based analysis system. Basic measurements could be done live, using the ubiquitous green sound level meters with moving coil metering, but the AC output of the meter was always put to good use.
A commonly used recorder was the Nagra IV-SJ, which in later incarnations could actually be used as a Type 1 sound level meter with the included life support for a condenser microphone and
cathode follower.
The application of the recording was to make frequency analyses of the signal, using serial filter analysis, either in 1/3 octaves or narrow band. If the measured signal was
stationary, then it was simply a case of recording enough tape to allow the analyser to run through its filters, linked to a paper chart recorder.
However, if analysis of transients was required (sonic booms and other big bangs were of great interest at the time!), then it became necessary to record the event, and then create a tape loop so the signal could be fed through again and again until the analysis was complete.
Newer recorders were based on FM techniques, which extended the frequency response down to DC, essential for correct phase measurement in transients and low frequency vibration.
Ultimately, the digital world arrived with the possibility of a solid state digital recorders, acquiring up to a mighty 10,000 samples with 8bit resolution to RAM memory, which could then be output to the same analogue analysers, or even the new-fangled FFT analysers.
Tape recorders also found a large application in local authorities, where it became commonplace to record noise nuisances as well as measurement data, so the signal could be played back for evidential purposes. A popular machine at the time was the affordable Uher 4000, which was also a staple of the newspaper reporters of the time.
Calibration (1)
If sensible analysis is to be done from a tape recording, it’s essential to have some method of calibrating the subsequent analysis. Then, as now, the process is simply recording a signal from a portable calibrator attached to the recording front end, so the analysis can be set up when the signal is replayed.
This opened up many gotchas, such as what happens when the gain of the sound level meter is changed after calibration? Is the dynamic range of the tape recorder optimised to the measuring range of the sound level meter? Is the dynamic range of the analysis system adequately aligned to the range of the tape recorder?
Nothing changes, and we still have to be aware of what can go wrong when recording/analysis is done. We will come back to the calibration issue later.
Digital Recording
With the advent of analogue to digital conversion, the studio recording market quickly adopted new techniques offering more stability, performance and convenience to the recording process. It now became possible to record audio signals with high sample rates (e.g. 48kHz), and large bit depths (e.g. 16bit) on to (initially) magnetic tape, and ultimately computer hard drives. In order to cope with the high throughput of data, special interfaces were developed, such as SCSI, and hard drives were rated as suitable for audio according to their write speeds.
The digital recorders of the time often used their own proprietary operating systems, software and file formats, reducing the interoperability of hardware and portability of files.
At around the same time, the personal computer was born, resulting in wider use of open file formats for signal recording. The progenitors of the PC, IBM, and the hot-shot software developers at
Microsoft agreed on a standard file format for computer based recordings – enter the WAV file format, based on an existing open RIFF format. We were at last being exposed to the bings and
bongs of PCs, as we made errors or stored data, all generated by short 8bit, 22kHz WAV files.
The advent of Windows made PCs ubiquitous, although being interrupt driven, they weren’t best suited to recording and playback of signals without drop-outs or glitches, so any software had to be written to include careful buffering of data.
Audio Recording in Measurements
Digital recording for measurements started to become a reality with portable digital recorders such as Digital Audio Tape (DAT) and portable notebook PCs. The DAT recorder, such as the Sony D7, was almost ubiquitous in the local authority market, replacing the Uhers, and a side shoot of this was the rise of the noise nuisance recorder, with a variety of droll names such as Matron, Marvin, Night Nurse, etc. The idea was to install a DAT recorder (with a suitable SLM or front end) in a complainant’s premises, and give them a push button to start the recording when the annoyance occurred. Some amusing moments were also recorded, but essentially the date/time stamping of the digital recording made excellent evidence before the magistrate.
The use of portable computers for noise measurements was also developed, where, as well as noise measurements often to Type 1 accuracy (IEC 651/804), recordings could be made to disk in WAV format, as a function of trigger or manual control. The file could then be played back, or analysed through digital post-processing using filters or FFT. The only downside was portability, battery life and potential storage limit, with hard drives being considered ‘large’ at 270MB!
In the laboratory, some systems were developed purely for recording and analysis, where signals were recorded for later real-time editing and playback for sound quality purposes, sometimes along with RPM-related analyses. This is now standard stuff in the automotive sector for example.
Whither WAV?
The WAV file format has endured as a very flexible container for audio data and now can handle multiple channels, various bit depths (24bit now being common) and many sample rates. The format is essentially a string of binary values, with levels ranging from 1 to 224 across the dynamic range of the system. There is also a header ‘chunk’ which contains information about the string, as well as plenty of opportunity to insert additional data, often referred to as metadata.
In the multimedia/studio sector, this is now used for music files, so the INFO chunk can contain details of the artist, year, track name, album, etc – you will see these if you ever open a music file on a computer, or play them back on your music system.
Keeping this data in the header chunk means that the file is also usable for any application that has no use for it, and can be ignored. However, it also means that it can be used by an instrumentation manufacturer to add the all important calibration data and other information as necessary.
Unfortunately, there is no real standardisation of where this information is stored, so calibration data stored by one system may not be readable by downstream software from another maker. We
don’t want to make it too easy!
To illustrate this, we can see a recording opened in the popular free software ‘Audacity’, and we can see the waveform (some traffic noise) recorded in one channel, with a sample rate of 12kHz and 24bit.
The vertical scale has been expanded so we can see the signal has a range of about +/-0.0005 ‘things’. The full scale level of the file is +/-1 ‘thing’, which has been subdivided into 2 levels.
The software allows users to tweak the signal with a variety of tools, and even do a frequency analysis, a well as playback of course.
However, because the calibration field in the header is not readable by Audacity (and why should it be?), we can’t scale the signal with physical units.
If we open the file in some sound and vibration analysis software, then we have the following:
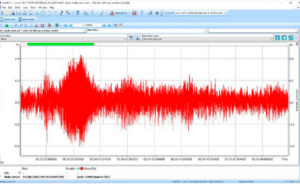
Note that the Y-axis is now calibrated in physical units (Pa), so the header knows what the full scale level is, and what units are being used. Additionally in the header, you will also find the instrument type, the serial number, the recording settings, and measurement range. In short, everything you need to make a correct downstream analysis.
One downside of the WAV format at present is the file size limitation of around 4GB owing to the 32bit container, but you can play tricks and break up the recording if needed.
Compression
WAV recording is uncompressed, so the output of the A/D converter is written directly into the binary stream with no change. This is ideal for downstream analysis, but can be rather wasteful on storage space. This was certainly a problem in the early days of both PCs and the internet, so compression techniques were developed to reduce the file size. There are lossy and lossless methods,
the former includes MP3 format, the latter includes FLAC format.
MP3 was developed as a way of removing all the features of the signal that we can’t hear anyway, due to masking and psychoacoustic effects, so it makes it ideal for music playback, where, depending on the amount of compression (bitrate), the music can be practically indistinguishable from the uncompressed version (being a dyed in the wool audiophile, I would disagree of course). But the drastically reduced file size makes the music more portable and downloadable. Again, the metadata is included, as with the WAV file.
FLAC is an open source format which compresses the file without losses, similar to ZIP compression. This means the original file can be reconstructed without loss, with a little bit of processing overhead when playing back. The header also has additional fields for e.g. album covers and the like.
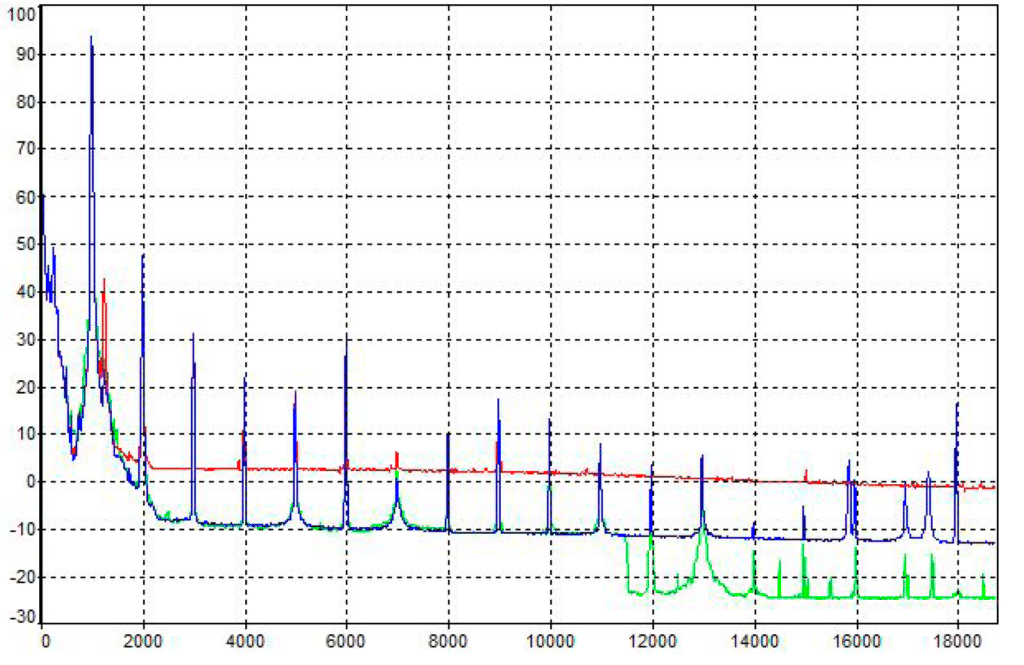
Clearly for instrumentation purposes, lossy compression is not acceptable, although an IOA paper I presented back in 1999 illustrated that the errors depend on the type of signal, the level of compression and the type of analysis. For example, if we take a 1kHz calibration tone, and compress it to MP3 with two bitrates of 64 and 128, the FFT spectra look as follows:
You can see that in the ‘passband’, the agreement is quite good, but where there are signals masked out, then the compression comes into play.
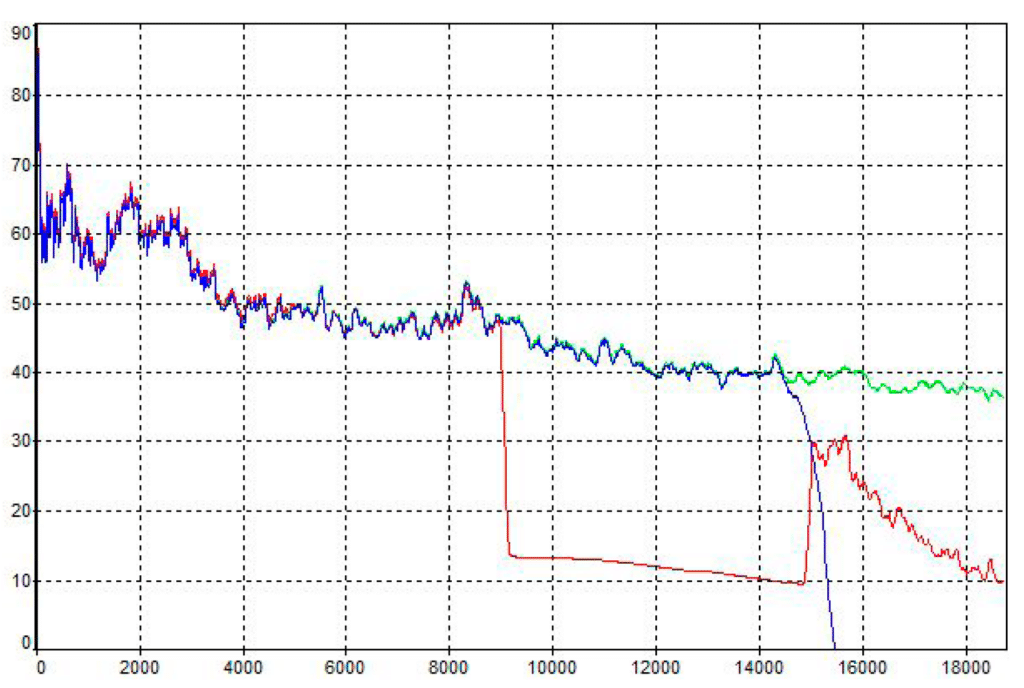
For a real signal such as a diesel engine, the results are similar Again the agreement at low frequencies is quite good, but there are some strange effects higher up.
For measurement purposes, we can’t use a format which modifies the data in an unpredictable way, so lossless is essential.
All is not lost for MP3 however. It’s very portable, smaller, and excellent for source identification and evidential purposes. After all, if it sounds like a plane, it probably is not Superman. You can find more information on this subject in Steve Cawser’s 2013 Instrumentation Corner article.
WAV files and standards
These days, WAV files are created and stored in the same device you are using for measurements – many sound level meters have an audio recording function. In this case, the digital audio stream is tapped off just after the A/D converter and stored to a file. This means the data is coming through the same measurement front end that is being used for your sound level data.
Many assume this is good enough to be able to say that any subsequent analysis will ‘meet Class 1 to IEC 61672’.
Be very careful with this. IEC 61672 is a standard which defines the performance of a sound level meter and must be considered in its entirety. Recording a WAV file, and analysing it is not strictly
a sound level meter. Yes, with a lot of care, you could run the process through the IEC 61672-3 tests, and maybe get the same result, but it’s not a sound level meter.
This was one of the reasons for the revision of the SLM standard from IEC 651/804. Too many were picking and choosing parts of the standard to claim compliance. The phrase ‘meets the relevant parts of IEC651/804 to Type 1’ was becoming commonplace. The current standard is a catch all. Your system either meets all of the standard or nothing.
WAV file playback
These days, WAV is so ubiquitous that playback is trivial. However, there are some catches. If the file has been created on a sound level meter, which may have a 24bit resolution, the meter will have been designed to cover the total range of, say, 25-135dB. When we record a WAV file, we are probably interested in low level noise, say around 40dBA or so. Bear in mind that this is a long way down the range of samples in the file. If we then play the signal through your PC, we may hear nothing at all!
Therefore digital gain can be a useful thing, i.e. the samples can be ‘moved’ to a more compatible range for playback. Take the example of Audacity above where the highest samples are 0.5 millithings. Some software can do this correction automatically.
Calibration
What happens if we don’t have calibration information? The same applies for the tape recorders above. Unless you know what physical level the most significant bit in the file corresponds to, you
will need to record a calibration tone as a file and make a note of any subsequent range changes.
What sample rate do I need?
The Nyquist criterion applies here. The sample rate should be at least 2.56 times the highest frequency of interest. In practice, if you want to analyse the 20kHz 1/3 octave band (including its upper skirt), then 51.2kHz sampling is ideal, 48kHz acceptable.
How long a signal do I need?
As Montgomery Scott was wont to say, ‘I cannae break the laws of physics’. The length of file will depend on how low in frequency you wish to go, and the bandwidth of any frequency analysis. The law is that the product of bandwidth and time cannot be less than unity (BT>1), and that’s for specific deterministic signals. For real-world signals, the BT product needs to be around 400 for a reasonable measurement uncertainty. Let’s say I need the 20Hz 1/3 octave band. The bandwidth of this filter is around 4.6Hz, so you’ll need a good length of recording, and a stationary signal
to get close to the right value. The same also applies to constant bandwidth analysis such as DFT. The more resolution, the longer the signal required.
Applications
We have seen that the main applications of WAV recording are to augment, rather than replace, fundamental measurements. They can be used for further downstream analysis, to provide data which was unavailable at the time of measurement, or requires more intensive processing, such as psychoacoustic or tonal/AM calculations. It also becomes possible to re-analyse the file
with different time and frequency weightings, out with the constraints of the SLM standards.
There is also an application for compressed files, where noise sources can be illustrated by listening, or, more recently, ‘Shazam’ type applications are evolving to allow automatic identification of noise sources using AI for example. The reduced file size makes MP3 ideal for fast upload to online servers for identification.
This is discussed in another Instrumentation Corner 2022 article from Paul McDonald, in the context of machine learning.
Conclusion
Hopefully, I have illustrated some of the history and technologies in audio recording technology for measurement purposes, and shown that with care, good acquisition and post-processing is possible and useful.
