Sound is everywhere, from the rustle of leaves, to the bustle of a motorway, you are always exposed to sound. That’s why we’re on a mission to find out where loud is too loud. We will be traipsing across the UK to find the noisiest (and sometimes the quietest) locations in the country.
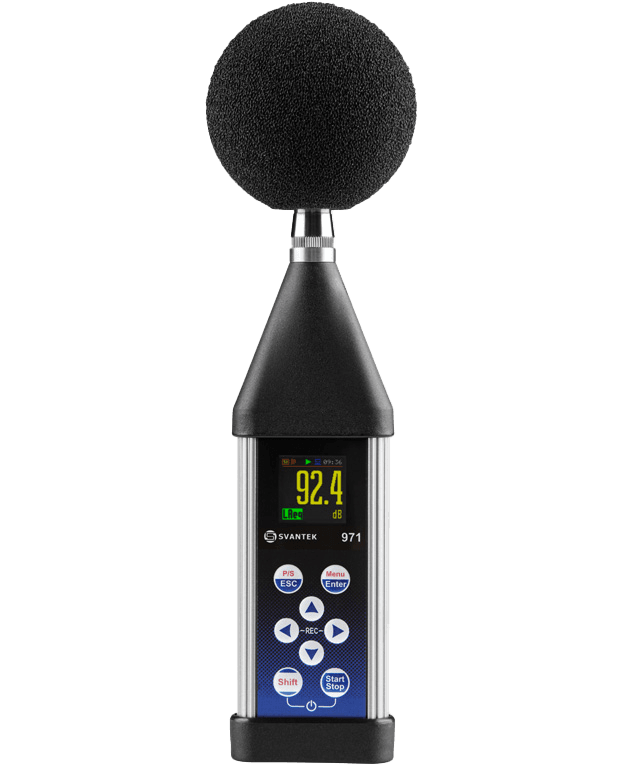
To find out, we’re taking measurements using the SV 971A handheld sound level meter, capturing real-world noise levels with professional-grade accuracy.
Standings
# | Location | LMAX | L90 | LAEQ |
|---|---|---|---|---|
| 1 | Northern Line | 105.7 dB | 81.4 dB | 98.4 dB |
| 2 | Waterloo & City Line | 100.2 dB | 81.2 dB | 91.7 dB |
| 3 | Central Line | 91.7 dB | 80.3 dB | 85.7 dB |
| 4 | Piccadilly Line | 98.8 dB | 77.8 dB | 85.0 dB |
| 5 | Jubilee Line | 92.9 dB | 80.4 dB | 84.7 dB |
| 6 | Victoria Line | 93.9 dB | 68.1 dB | 82.2 dB |
| 7 | Bakerloo Line | 87.3 dB | 77.7 dB | 81.7 dB |
| 8 | Circle Line | 87.6 dB | 73.8 dB | 81.4 dB |
| 9 | District Line | 82.8 dB | 67.9 dB | 77.6 dB |
| 10 | Thameslink to Bedford | 93.0 dB | 57.8 dB | 77.1 dB |
| 11 | DLR | 86.5 dB | 64.8 dB | 75.2 dB |
| 12 | Ralph Barking | 101.2 dB | 43.4 dB | 74.8 dB |
| 13 | Metropolitan Line | 82.7 dB | 68.8 dB | 74.8 dB |
| 14 | Hammersmith & City Line | 81.6 dB | 67.3 dB | 74.7 dB |
| 15 | Elizabeth Line | 81.3 dB | 68.2 dB | 74.3 dB |
| 16 | London Victoria Station | 77.9 dB | 69.1 dB | 73.3 dB |
| 17 | Big Ben | 82.8 dB | 68.2 dB | 72.6 dB |
| 18 | Manchester Victoria Station | 79.0 dB | 69.2 dB | 71.3 dB |
| 19 | Piccadilly Circus | 76.8 dB | 66.7 dB | 70.5 dB |
| 20 | London Bridge Station | 78.6 dB | 66.0 dB | 70.5 dB |
| 21 | Manchester Piccadilly Station | 77.7 dB | 61.9 dB | 68.3 dB |
| 22 | Battersea Power Station | 79.6 dB | 55.6 dB | 65.9 dB |
| 23 | Kings Cross Station | 71.2 dB | 58.9 dB | 64.7 dB |
| 24 | Oxford Circus | 69.5 dB | 59.8 dB | 63.1 dB |
| 25 | Canary Wharf | 71.6 dB | 58.4 dB | 62.6 dB |
| 26 | The Shard | 65.7 dB | 56.1 dB | 60.3 dB |
| 27 | The BCTA Hub | 72.6 dB | 40.5 dB | 58.3 dB |
| 28 | Manchester Airport | 56.5 dB | 50.8 dB | 54.7 dB |
| 29 | Semi-Anechoic Room | 47.8 dB | 14.7 dB | 36.3 dB |
What We’re Measuring
Each location we measure will be assessed under controlled conditions to ensure consistency. The LAeq values will show the overall noise climate, while L90 will help separate persistent background noise from intermittent events. The LMax readings will highlight the most intense moments, offering a complete acoustic profile of each site.
We know that raw noise data is key. Our measurements will focus on three key parameters:
- LAeq (Equivalent Continuous Sound Level): The average sound level over a given period, providing an overall picture of noise exposure.
- L90 (Background Noise Level): The level exceeded 90% of the time, often used to assess ambient conditions and identify consistent background noise.
- LMax (Maximum Sound Level): The peak level recorded during a measurement period, highlighting the loudest single event.
These measurements will all be taken from our class 1, SV 971A sound level meter, with it’s compact design and class 1 accuracy, we can be sure to get the most accurate results. We’ll also have help from the assistant pro, allowing us to view data from the meter on the phone.
Check out our SV 971A to see what else this nifty little meter can do.